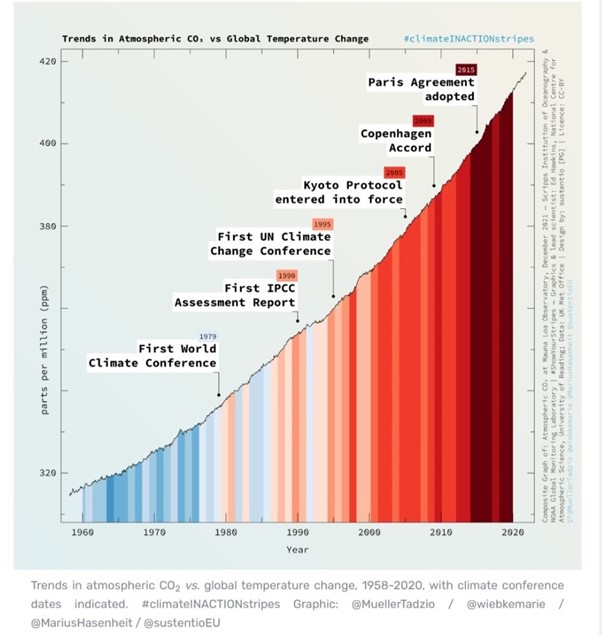
CO2 keeps rising despite 30 years of compliance carbon markets !
Part 2: Cap & trade – compliance market solutions
What is Cap & Trade?
A market is created by an (inter-)governmental body, such as the European Commission (EC), as it gives out, or sells at auction, pollution allowances to operators of power generation and energy-intensive industries. At the end of the year, these operators need to comply and hand in the number of allowances corresponding to the amount of pollution they emitted. If they don’t, they face heavy fines. By slowly decreasing ‘the cap’, which is the total amount of pollution, which is allowed to be emitted annually, the (inter-)governmental body steers the decrease of emissions within their economic area. The allowances may be traded between operators, and the price for the emissions is set by the market. This has been touted as a highly cost-effective approach to cut emissions. A certain number of allowances from the voluntary ‘carbon offset’ market were also permitted to cover emission obligations.
If free emission allowances are provided, polluters are permitted to continue polluting and to profit from selling allowances in the market. However, if allowances are auctioned and fines imposed, revenue is generated, which is supposed to be spent on climate action measures.
European Emissions Trading System (ETS)
ETS began in 2005, and mainly covers the power, aviation and industry sectors, about 40% of the economic sectors in the EU. European emissions were reduced by ~32% between 2005 and 2020.[1]
In February 2023, the European Council and Parliament agreed on a revised ETS target of 62% emissions reduction by 2030, as compared to 2005, which means accelerating emission reductions. The 2023 revision now also includes shipping in the ETS. A new market, ETS II, is also now being set up to cover fuel distribution for road transport and buildings, and additional industrial sectors. Implementation begins in 2027.
Lax beginning - free allowances
Windfall profits
The flood of free allowances gave companies windfall profits, totaling around 50 billion euros in the period from 2008-2019. A study of 19 EU countries found that companies profited in three ways: from selling free allowances on the market, from using much cheaper international “carbon offsets” for compliance, and by passing through ‘costs’ to their customers by raising prices.[6]
Tightening up – Market Stability Reserve
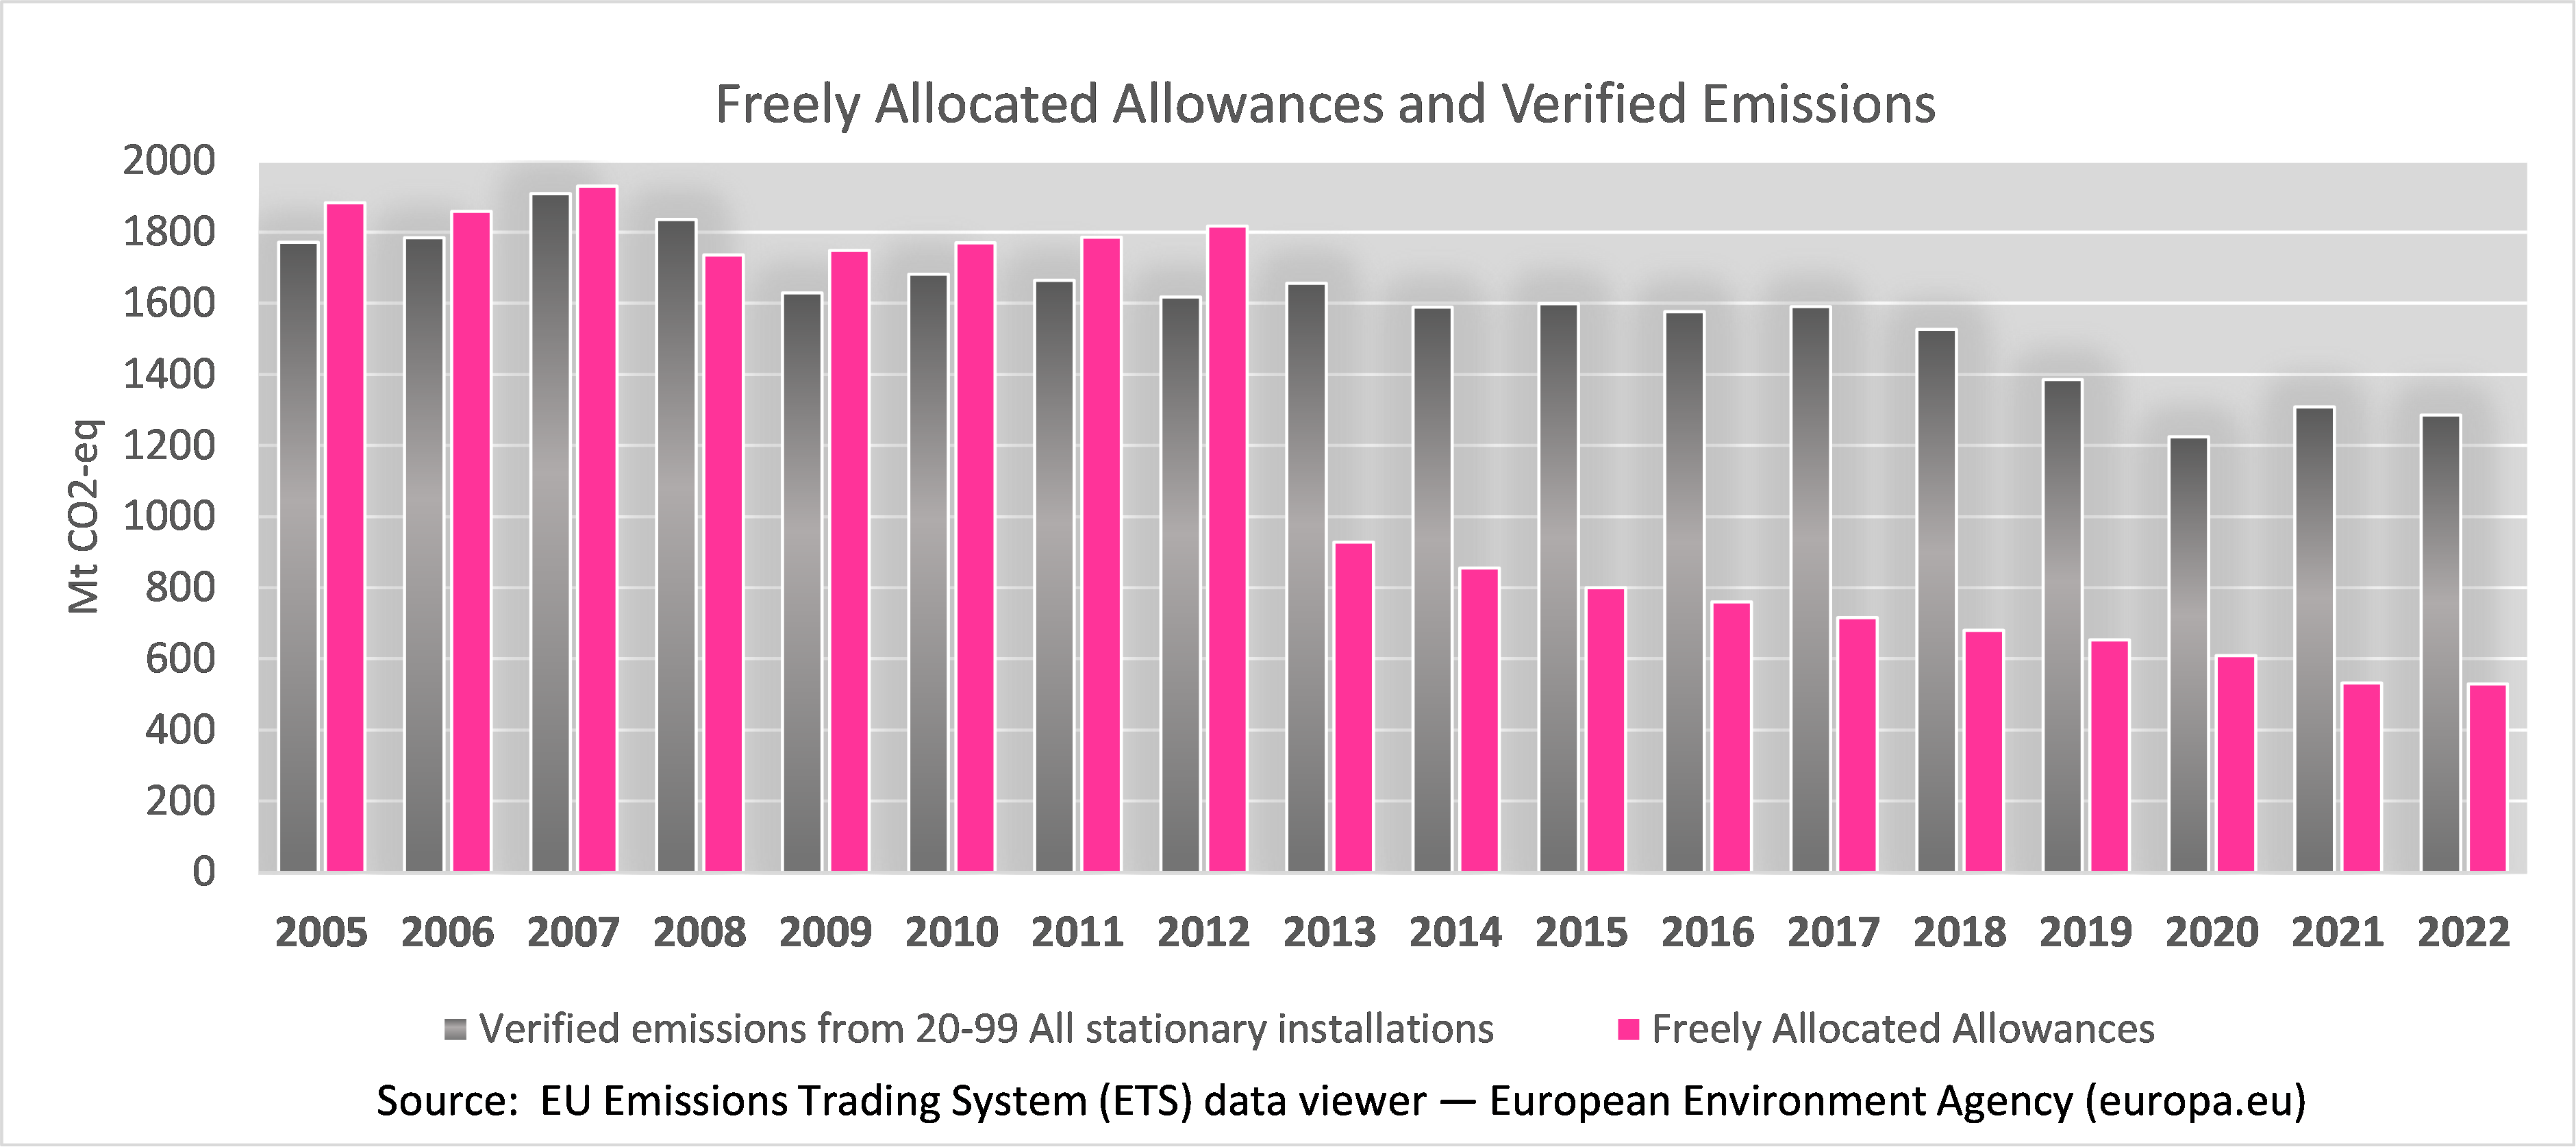
In the period 2013-2020, (ETS Phase III), the oversupply of free allowances continued, but not to the same degree. In 2013, free allowances covered 56% of emissions, decreasing to 41% in 2022. (Figure 1) Despite auctioning of some allowances in the power sector, the market price remained under €6 per tonne CO2 until 2018 due to the accumulation of free allowances in the market over the previous years. The Market Stability Reserve (MSR), a mechanism to draw down the number of free allowances and control the number auctioned each year, came into effect in 2019. Between 2018-2022, the price rose to about €80/tonne CO2.[7] There is disagreement over how high this price has to be to reach the goals of the Paris Agreement. In a 2021 Reuters survey, economists recommended a median price of $100/tonne CO2 (up to $250/tonne CO2), as necessary to reach the Paris Agreement goals.[8] Other studies suggest that the price should be in the range of €180 – €640 per tonne CO2.[9] But the price will only stimulate the desired change if free allowances are no longer given out.
Carbon Border Adjustment Mechanism (CBAM)
The flood of free allowances to industry and manufacturing was a response to the concern that if ETS requirements made products more expensive and less competitive, these companies would move out of Europe. To date industry has not reduced its emissions at all. (Figure 2) To counter this, the EC and the European Parliament agreed in December 2022 to set up a carbon tax on imports from outside Europe, the Carbon Border Adjustment
Mechanism (CBAM). While the CBAM reporting mechanisms started in October 2023, there is a long transition period. Industry and manufacturing sectors will slowly be eased into having to reduce their emissions as their free allowances are phased out, beginning in 2026 with 2.5% reduction of free allowances out to the elimination of free allowances in 2034.[10] This means that manufacturing and industry will only have to fully comply with emission reductions in 2035, thirty years after the start of the ETS!

The money
A market is supposed to be, above all, an economically efficient way to achieve lower emissions. However, the flood of free permits which were doled out has not only prevented the market from working, but it has been very expensive for taxpayers. Over the 2013-2021 period, Member States earned a total of €88.5 billion from selling emission allowances under the ETS, €10 billion less than they gave away to companies in free allowances.[11] What is worse, the companies that received this subsidy did not have to reduce emissions.
In 2023, it was agreed that Member States should allocate all ETS revenues to climate-related measures, a significant increase from the previous 50% requirement for climate goals. Because of inadequate reporting and boundary conditions, some of the previous ETS revenues went into counterproductive activities, such as subsidies to compensate for carbon price and fossil fuel projects.[11] The ETS is a primary tool for generating the average yearly investment of ~400 billion that the EC estimates is necessary to meet the revised 2030 climate target, but to date it has not been used effectively.[11]
Equity and social justice issues
Industrial companies, like refineries and steel factories, who receive free allocations are rewarded while they continue polluting. It has long been observed that polluting factories locate themselves in neighborhoods that have traditionally been home to people who have less power in society. While the market system focusses on delivering cost efficiency to companies, it does not effectively reduce emissions to the benefit of all stakeholders, including citizens. A documented case of six refineries in California’s cap and trade system were able to increase emissions, including air toxins, by having fulfilled their compliance without taking action on their own installation.[12] These emissions, year after year, create toxic hotspots, in which people suffer from diseases related to air toxins, with no voice in the matter, and are thus described as ‘sacrifice zones’.[12]
Summary
Free allowances have subverted and delayed the functioning of the ETS. While the European power sector has reduced emissions by switching to fuels with a lower carbon density than coal (such as natural gas), and to increasing generation of renewable energy, the industry and manufacturing sectors have not reduced their emissions. The coddling of big business has led to a three decades-long delay in decarbonization. This year more ambitious plans were agreed, but it remains to be seen whether they will deliver the transition Europe needs in the time we still have to stay within 1,5 – 2°C of warming. Under the mantra of cost efficiency, manufacturing and industrial installations have gotten away with 30 years of non-compliance, and on top of that have received windfall profits. Taxpayers, on the other hand, have not received the revenues needed for climate action. This system has not been effective in reducing emissions and has left neighborhoods around polluting manufacturing and industrial installations, as ‘sacrifice zones’, to develop into toxic hotspots.
[1] European Environment Agency (EEA), “Total greenhouse gas emission trends and projections in Europe”, 26 October 2022, eea.europa.eu/ims/total-greenhouse-gas-emission-trends
[2] European Environment Agency, Allowances and Emissions, https://www.eea.europa.eu/data-and-maps/dashboards/emissions-trading-viewer-1
[3] European Environment Agency, Why did greenhouse gas emissions decrease in the EU between 1990 and 2012?, 28 May, 2014, https://www.eea.europa.eu/publications/why-are-greenhouse-gases-decreasing
[4] Gilbertson, T. and Reyes, O., (2009) Carbon Trading-How it works and why it fails, Dag Hammarskjöld Found ation,http://www.daghammarskjold.se/wp-content/uploads/2014/08/cc7_web_low.pdf
[5] Dechezleprêtre, A. et al., The joint impact of the European Union emissions trading system on carbon emissions and economic performance, Journal of Environmental Economics and Management, Vol. 118,(2023), 102758, ISSN 0095-0696, https://doi.org/10.1016/j.jeem.2022.102758
[6] CE Delft, (2021, May) Additional profits of sectors and firms from the EU ETS –Report 200402, https://carbonmarketwatch.org/wp-content/uploads/2021/06/CE_Delft_Additional_Profits_ETS.pd6
[7] Ember, Carbon Price Tracker, https://ember-climate.org/data/data-tools/carbon-price-viewer/
[8] https://www.reuters.com/business/cop/carbon-needs-cost-least-100tonne-now-reach-net-zero-by-2050-2021-10-25/
[9] Dr. A. Matthey, “Methodological Convention 3.0 for the Assessment of Environmental Costs”, November 2019, p. 8, umweltbundesamt.de/sites/default/files/medien/1410/publikationen/2019-02-11_methodenkonvention-3-0_en_kostensaetze_korr.pdf
[10] European Commission Taxation and Customs Union, Carbon Border Adjustment Mechanism, https://taxation-customs.ec.europa.eu/carbon-border-adjustment-mechanism_en
[11] World Wide Fund for Nature (WWF), 2022, Where did all the money go? How EU Member States spent their ETS revenues – and why tighter rules are needed. https://wwfeu.awsassets.panda.org/downloads/ets_revenues_report_2022___web___final.pdf
[12] Lejano, R. Front. Environ. Sci., 10 November 2020, Sec. Environmental Economics and Management, Volume 8 – 2020 | https://doi.org/10.3389/fenvs.2020.593014